The city of Fairweather is located in the Northwest in a region known for its plentiful rainfall. The city serves one million people, approximately half of which live within the city. The remainder live in other incorporated, outlying areas and are served by purveyors. The regional purveyors have relied on Fairweather to reliably deliver water when it is needed.
Physical Setting
The city of Fairweather currently receives its water from two major surface reservoirs, and has a small volume of supplemental groundwater. The streams upon which the reservoirs are located have in-stream flow requirements that have been negotiated with natural resource and fishery agencies.
The region surrounding Fairweather is growing, although Fairweather’s population has been relatively stable over the last decade. The regional growth rate is about 3% per year.
Political Setting
The city’s water department works with a variety of agencies on water issues. Historically, Fairweather has been a very powerful player, being the provider of the region’s drinking water. Agencies with which they interact include the state’s Department of Ecology, Department of Health, tribal government interests, federal fisheries agencies, and the Corps of Engineers. Water plans must be adopted by the city council and be approved by the city’s mayor.
Recent History
Although noted for its rain, Fairweather has experienced drought. Water supply has been significantly impacted twice during the past seven years. In both instances, water use restrictions were initiated. These restrictions included the regulation (then elimination) of outdoor lawn watering. Although the public accepted these restrictions, the Fairweather water department would not like to test their patience again. Following the second major drought, the superintendent and several key staff at the water department chose to pursue careers in the private sector. This has left a void at the top levels of decision making.The fisheries agencies and the tribal governments have been more effective in recent years in conveying their objectives both in public forums and in inter-agency negotiations. In-stream flow requirements, established in the 1960’s are being re-examined and there appears the strong possibility that increased emphasis will be placed on in-stream water uses.
Purveyors are dissatisfied with the level with which water is delivered to them. The two recent droughts has caused both concern and resentment among the purveyors because of their need to curtail demand. These curtailments created significant political fallout, raising the scepter of controlled growth, the potential for several new water departments that might serve the growing suburban regions, and the potential for new sources of water that could either be developed by Fairweather or by the new water departments.
Hydrology
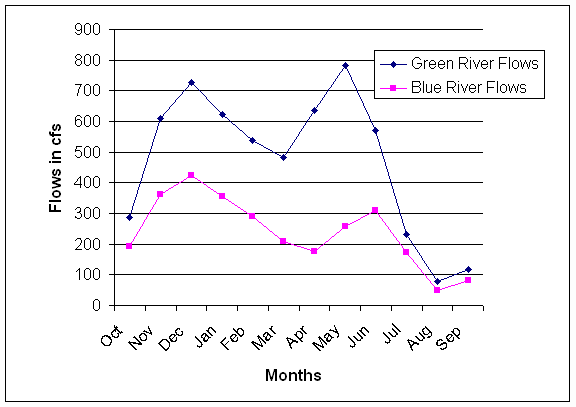
A relatively constant rainfall throughout the year drives the hydrology of the region. The reservoirs are primarily fed by rainfall and snowmelt in the fall, winter and spring. Summer precipitation is lower than the remainder of the year. Thirty years of stream flows exist for sites of interest. Monthly summaries of flows into the reservoirs are given in Table 1.
Demand
Water demand demonstrates a typical seasonal demand pattern in Fairweather, summarized in Figure 4 and Table 1. The base demand is currently 180 mgd. Demand forecast models have also been prepared to identify the principal components of demand in the future.
Fish Requirements
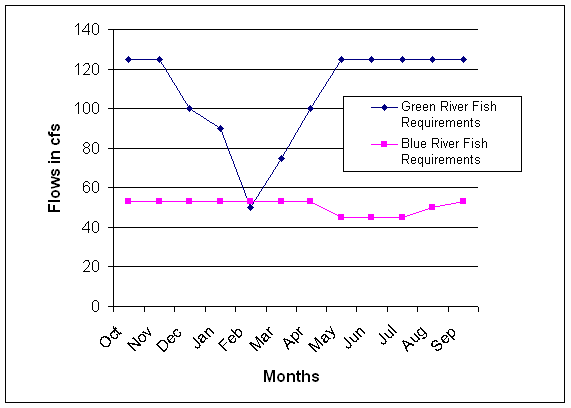
The Blue, Green and Red Rivers all have in-stream flow requirements to maintain fish production. These values are under negotiation, but the current values are found in Table 1. Red River In-stream Flow requirements are currently defined as a percentage (75%) of the combined in-stream flow requirements upstream.
Groundwater
Fairweather utilizes groundwater as a supplemental source during periods when demand cannot be fully met by the surface diversion. The maximum pumping rate of their well system is 10 mgd.
Reservoir Operation
The Blue and Green are currently operated conjunctively, and target releases have been established for each reservoir. Currently the Green reservoir target is equal to 60% of the total system demand, and the Blue reservoir target is 40%. Rule curves governing refill and drawdown have been established for each reservoir.
General Requirements for Plan Development
Fairweather must prepare a comprehensive plan every five years that outlines planning objectives and management guidelines for a twenty-five year planning period. These guidelines must identify a desirable level of system reliability, outline strategies for managing shortfalls, and describe plans for future system expansion. Fairweather’s Planning Approach Fairweather wishes to create a more open dialogue with its purveyors, the city council, the mayor’s office, and the citizens of the region. They hope to accomplish this by creating a more open and direct planning framework in which stakeholders will contribute to all phases of the planning effort.
Fairweather is developing a planning approach to meet these goals. Currently they must:
1. Define the goals of the planning process
2. Develop planning steps to implement the goals
3. Define the actions and products required in each planning step
4. Describe how each step will be achieved
5. Estimate the costs of implementation
6. Identify likely stumbling blocks to implementing the planning goals
The goals and steps of the planning process must consider the political realities of the system and the limited budget that is likely to be available. They must also consider the uncertainties and risks that are associated with alternatives. These uncertainties are not only hydrologic but also social and economic.
Table 1 - Summary of Data
|
|
Green Inflows
(cfs)
|
Blue Inflows
(cfs)
th> |
Fairweather
Demand Pattern
(mgd)
|
Green River
Instream Flow Req.
(cfs)
|
Blue River
Instream Flow Req.
(cfs)
|
|
Jan
|
622
|
355
|
0.8
|
90
|
53
|
|
Feb
|
537
|
289
|
0.8
|
50
|
53
|
|
Mar
|
481
|
209
|
0.8
|
75
|
53
|
|
Apr
|
637
|
177
|
0.8
|
100
|
53
|
|
May
|
784
|
257
|
0.8
|
125
|
45
|
|
Jun
|
572
|
310
|
1.2
|
125
|
45
|
|
Jul
|
231
|
172
|
1.4
|
125
|
45
|
|
Aug
|
79
|
50
|
1.4
|
125
|
50
|
|
Sep
|
118
|
81
|
1.2
|
125
|
53
|
|
Oct
|
288
|
191
|
0.8
|
125
|
53
|
|
Nov
|
610
|
363
|
0.8
|
125
|
53
|
|
Dec
|
728
|
425
|
0.8
|
100
|
53
|

Figure 1 - Average Monthly Flows

Figure 2 - Fishflow Requirements